

Improving OEE With Factory-Wide Data Integration & Digital Dashboards
How Practicon helped improve production efficiency by connecting existing PLC systems, deploying Ethernet Remote I/O and combining process and energy data into a centralised plant performance monitoring solution.
Client Overview
Our client operates a specialist manufacturing facility where consistent process conditions, reliable equipment and efficient use of energy are essential to maintaining production.
The factory incorporates multiple reactor systems, cooling equipment, pumps, electrical distribution networks and independent manufacturing machines. Each contributes to overall production performance, but much of the operational information was held within individual control systems or was not being collected centrally.
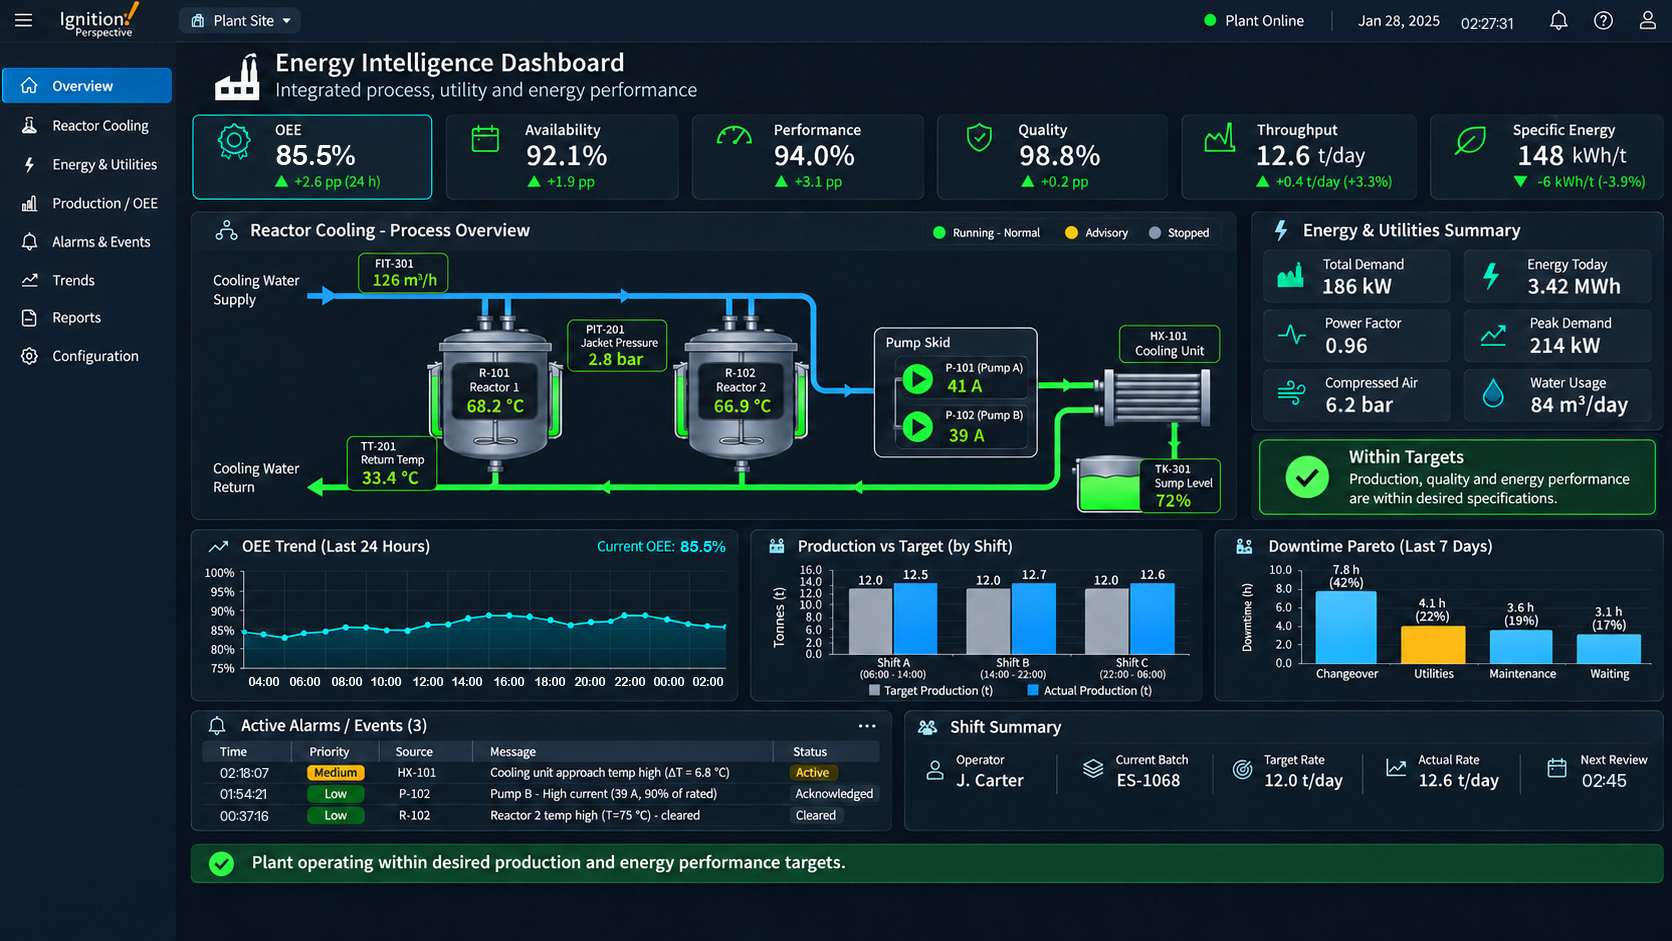
Practicon has supported the client across several automation projects, including upgrading its critical reactor cooling system, expanding electrical energy monitoring and integrating additional plant instrumentation. These projects formed the basis of a wider factory data collection and monitoring solution, using Inductive Automation’s Ignition platform to provide operators with meaningful production KPIs, OEE measurements and real-time plant performance dashboards.
The Challenge
Like many manufacturing facilities, the client had considerable amounts of useful information available across its equipment, but gaining a clear picture of overall plant performance was more difficult.
Individual PLC systems monitored their own machines, while energy meters collected electrical information from different areas of the factory. Other sensors and instruments were installed independently, without being connected to a central automation or monitoring system. This meant that valuable information relating to equipment availability, process performance and energy consumption was spread across different systems.
Operators could see whether individual machines were running, but it was harder to establish whether the wider plant was operating at its intended production rate or whether changes in process conditions were beginning to affect efficiency. The reactor cooling system was a particularly important example. Supporting a manufacturing process incorporating more than 30 reactors, maintaining reliable cooling flowrates and pressures was essential. Problems with cooling performance could have significant consequences for production availability.
At the same time, the customer wanted better visibility of electrical demand and consumption to understand how energy was being used throughout the factory. The challenge was to bring all this information together, including measurements that were not previously available, and turn it into something operators could use to improve plant performance.
The objective was not simply to monitor more equipment. It was to improve Overall Equipment Effectiveness (OEE), reduce avoidable production losses and give operators immediate visibility of whether the plant was performing within its required specifications.
The Approach – Connecting the Factory
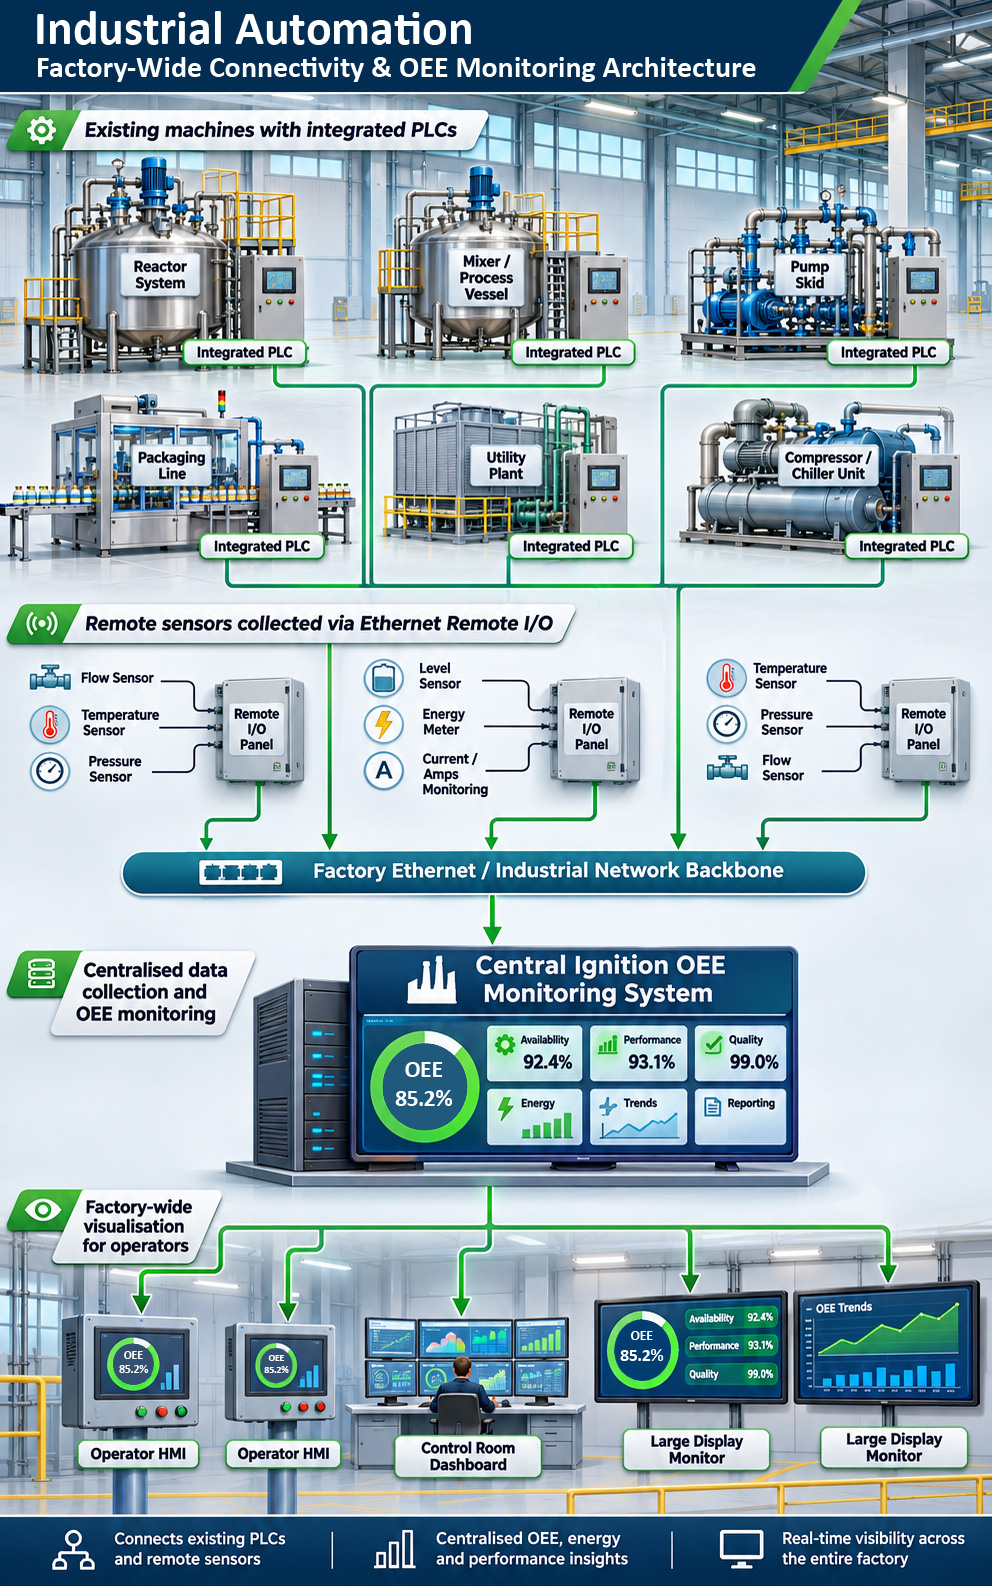
Practicon developed a tailored approach that made use of the customer’s existing automation infrastructure while introducing additional data collection where required. Rather than replacing established control systems, the solution integrated information from different equipment and communication networks into a centralised monitoring environment.
Connecting Existing PLC Systems
Many of the factory’s machines already operated through independent PLC control systems. Practicon established communications with these systems to access relevant sensor measurements, machine running conditions, fault indications and operational statuses.
This allowed information previously held within individual machines to be collected and analysed alongside data from other areas of the factory. By sharing machine and process information, the central monitoring system could establish a much clearer understanding of equipment availability, operating conditions and potential causes of production losses.
It also avoided unnecessary modifications to existing machine control functionality.
Ethernet Remote I/O for Additional Sensors
Not all the required information was available from existing PLC systems. In some areas, sensors and instruments were operating independently, without any connection to the factory’s automation infrastructure. Additional sensors were also required to capture more useful plant or production operational data
Practicon addressed this by deploying distributed Remote I/O connected over the factory Ethernet network. The Remote I/O installations allowed measurements from previously unconnected sensors to be collected and made available to the central monitoring system.
Positioning the I/O closer to the instruments reduced the need for extensive individual cable runs back to central control panels, providing a practical and flexible way of extending factory-wide monitoring. This was an important part of the project, allowing the monitoring solution to incorporate information that had previously been unavailable for performance analysis.
Integrating Electrical Energy Data
Practicon also undertook improvements to the client’s electrical energy monitoring infrastructure. The existing installation included more than 60 Modbus Rayleigh D480 and F400 electrical energy meters across four existing PLC installations associated in two separate parts in the factory.
Practicon re-engineered the PLC communication to improve data collection efficiency, grouping Modbus register reads and prioritising measurements requiring more frequent updates.
The energy monitoring information included electrical current, voltage, power demand and accumulated energy consumption. Higher-priority information was collected at nominal 10-second intervals, while less time-sensitive information was collected at longer intervals.
This provided the electrical information needed to compare energy consumption with machine operating conditions and production output.
Incorporating Reactor Cooling Data
The reactor cooling system provided another valuable source of process information. The data from the cooling system, including flowrates, pressures, temperatures, pump conditions and equipment status, was incorporated into the wider plant monitoring approach.
This allowed cooling performance to be considered alongside production activity and energy usage rather than monitored in isolation.
The Solution – Centralised Data and Ignition Dashboards

With the information collected from across the factory, Practicon used Inductive Automation’s Ignition Platform to create a centralised plant performance monitoring solution. The dashboards brought together live process measurements, equipment operating states, energy consumption and production information, translating them into meaningful KPIs for operators, engineers and production managers.
Rather than presenting large quantities of raw instrument data, the screens were designed around the information needed to understand how efficiently the plant was operating.
Turning Plant Measurements into OEE
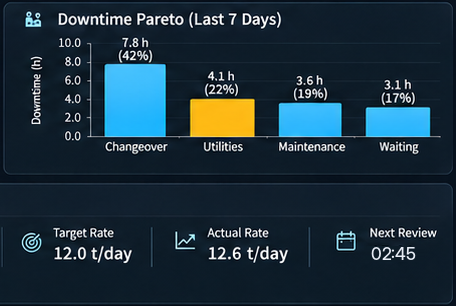
A major focus was developing OEE measurements using information gathered from the production equipment. By combining machine availability, operating performance and product quality information, the system provided a clearer understanding of where production efficiency was being lost.
The dashboards allowed operators to see OEE performance alongside the factors contributing to it, helping distinguish between downtime, reduced operating rates and quality-related losses. This was supported by additional measurements such as production throughput, equipment utilisation, operating hours and time spent outside required process conditions.
The result was a more useful view of production efficiency than simply knowing whether individual machines were running.
Linking Energy Consumption to Production Performance
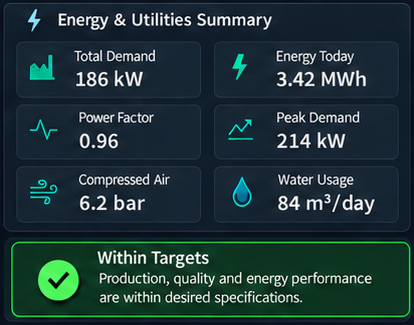
Integrating electrical energy measurements added another important dimension to the dashboards. Operators could monitor electrical demand and consumption across individual areas and compare these values with production output and equipment operating conditions.
This enabled meaningful energy-related KPIs, including energy consumed per unit of production. For example, an increase in pump motor current could be viewed alongside cooling flowrate and operating conditions to help establish whether the equipment was working efficiently.
Similarly, increased electrical consumption without a corresponding increase in production could indicate equipment running unnecessarily or operating outside its most efficient range. By placing energy information alongside production KPIs, the dashboards helped operators consider both production performance and the resources required to achieve it.
Monitoring Process Specifications and Operating Targets
A further important aspect of the Ignition dashboards was the ability to show whether plant equipment was operating within its required production specifications. Critical measurements such as temperatures, flowrates, pressures, levels and electrical loading were displayed against defined operating limits.
Clear graphical indicators showed normal operation, developing warnings and conditions requiring attention. Historical trends allowed operators to identify changes in performance and investigate how individual process measurements were affecting production.
This made it easier to identify and address developing problems before they resulted in more significant losses.
Making Information Visible Throughout the Factory
Practicon deployed Ignition dashboards at strategic locations throughout the plant, allowing operators to view current performance without having to access multiple independent machine control systems.
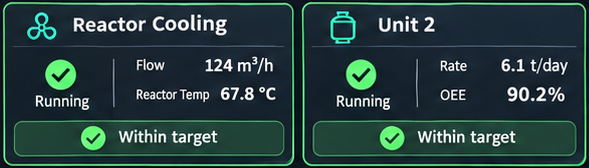
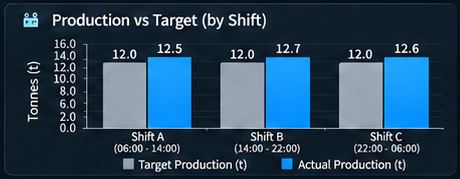
The screens were designed around the operational requirements of different production areas. Dashboards near process equipment concentrated on critical measurements such as flowrates, temperatures, pressures, vessel levels and pump conditions. Production-area dashboards displayed OEE, equipment availability, actual output against production targets and active alarms.
Energy dashboards provided visibility of electrical consumption, power demand, motor currents and energy performance across different factory areas. Larger performance displays gave operators a clear overview of plant operating conditions, using prominent KPI values and colour-coded status indicators that could be understood at a glance.
Ignition also allowed the same underlying information to be presented in different formats, making it possible to provide detailed engineering views alongside simpler production-focused displays. The emphasis was on making the information accessible and useful to the people responsible for operating the plant.
The Result – Improved OEE and Better Operational Decisions
Bringing together factory-wide process, machine and energy information through Ignition improved the visibility of plant performance and helped the client increase Overall Equipment Effectiveness. Operators were no longer limited to reviewing individual machine conditions in isolation. They could see how equipment availability, production throughput and operating conditions contributed to overall performance.
This supported improvements in several important areas.
Improved equipment availability
Centralised machine status monitoring and clearer identification of stoppages helped operators recognise equipment problems sooner and respond more effectively, reducing avoidable production losses.
Improved production performance
By comparing actual production rates against targets, operators could recognise when equipment was running below its expected performance and investigate potential causes.
Greater process consistency
Monitoring critical flowrates, temperatures, pressures and other measurements against specified limits helped operators maintain more consistent process conditions and identify deviations earlier.
Better energy efficiency
Combining electrical energy readings with production and equipment information made it easier to identify periods of excessive demand and assess how efficiently energy was being used.
Improved reporting and analysis
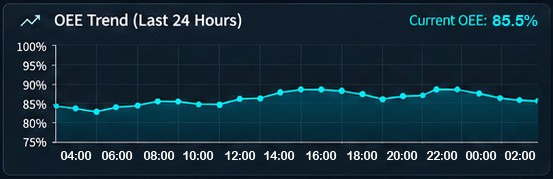
Centralising the information provided a consistent source of historical data for reviewing OEE, investigating downtime, comparing operating periods and identifying recurring performance issues. The dashboards also reduced the reliance on manually gathering information from individual machines and control systems, giving production and engineering teams a clearer understanding of plant performance.
The result was not simply better monitoring. It was an improvement in how production information was used, supporting faster decisions, more consistent operation and higher OEE.
Added Value – Connecting Existing Equipment to Deliver Measurable Benefits
A major strength of the project was Practicon’s ability to work with the customer’s existing equipment and infrastructure. Different machine control systems, standalone instruments, Modbus energy meters and newly deployed Ethernet Remote I/O were brought together without requiring the replacement of established automation systems. This required an understanding of both the technical integration and the manufacturing processes being monitored.
Practicon’s experience in PLC engineering, industrial communications, SCADA development and process automation meant the solution could be tailored to the equipment, operational priorities and performance requirements of the factory. Using Ignition also provided a flexible visualisation platform, allowing the information gathered across the plant to be presented in clear, consistent dashboards designed for different users and production areas.
The result was a system focused on delivering useful information rather than simply collecting more data.
Conclusion
The work undertaken for the client demonstrates how connecting existing automation systems and capturing previously unavailable plant information can deliver improvements in manufacturing performance. By combining reactor cooling measurements, machine operating information, Ethernet Remote I/O and electrical energy data, Practicon created a centralised foundation for plant performance monitoring.
Through Ignition, this information was transformed into meaningful OEE measurements, operational KPIs and graphical dashboards positioned throughout the factory.
Operators gained a clearer understanding of how the plant was performing against its production targets, allowing them to recognise developing problems, investigate inefficiencies and make more informed decisions. By turning disconnected machine and plant data into actionable production information, Practicon helped the client improve OEE, strengthen operational visibility and make more effective use of its existing manufacturing infrastructure.
